Skip to content

Electric vehicles captured 14% of the new car market in 2024, while hybrids claimed another 16% – together representing nearly a third of all vehicles sold. If you’re shopping for a new car in 2025, chances are you’re considering one of these electrified options.
But the financial comparison isn’t straightforward. With EVs costing an average of $7,500 more than comparable gas models and hybrids falling somewhere in between, car shoppers face a complex calculation: Will the operating savings eventually offset the higher purchase price?
The truth is, there’s no universal answer. Your specific circumstances—driving habits, local electricity rates, available tax incentives, and even where you live—ultimately determine which technology makes the most financial sense for you.
Let’s break down the true ownership costs for each technology to help you make the smartest financial decision for your situation.
Understanding Today’s Electrified Vehicle Options
Before diving into the financial comparison, let’s clarify the key differences between these technologies.
Full Electric Vehicles (EVs)
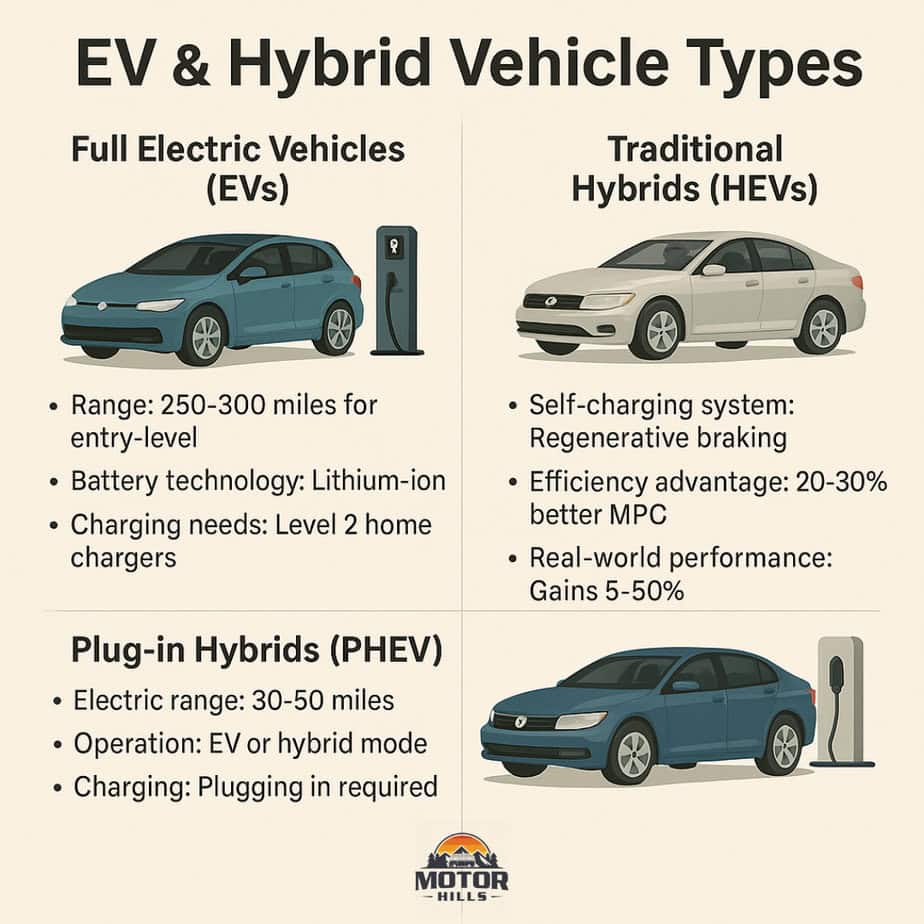
Modern EVs run exclusively on battery power, with no gasoline backup. Recent advancements have dramatically improved their capabilities:
- Range: Entry-level models now typically offer 250-300 miles per charge, with premium options exceeding 400 miles
- Battery technology: Lithium-ion batteries with 8-10 year/100,000+ mile warranties are standard
- Charging needs: Most owners install Level 2 (240V) home chargers, though public charging infrastructure continues to expand
Traditional Hybrids (HEVs)
Conventional hybrids like the Toyota Prius seamlessly blend gas and electric power without requiring manual charging:
- Self-charging system: The battery recharges through regenerative braking and the gas engine
- Efficiency advantage: Typically delivers 20-30% better fuel economy than comparable gas-only vehicles
- Real-world performance: Highway efficiency gains are modest (5-15%), but city driving can see 30-50% improvement
Plug-in Hybrids (PHEVs)
PHEVs bridge the gap between EVs and traditional hybrids with larger batteries that enable electric-only driving:
- Electric range: Typically 30-50 miles before the gas engine activates
- Operation: Functions as an EV for short trips, then seamlessly switches to hybrid operation for longer journeys
- Charging: Requires plugging in for full benefits, but chargers can be standard 120V outlets
Purchase Price Reality Check
2025 Price Comparison Across Segments
| Vehicle Segment | Gas Model | Hybrid | PHEV | EV |
|---|---|---|---|---|
| Compact | $23,000 | $27,000 | $32,000 | $35,000 |
| Midsize Sedan | $28,000 | $32,000 | $37,000 | $42,000 |
| Compact SUV | $30,000 | $34,000 | $39,000 | $45,000 |
| Midsize SUV | $38,000 | $43,000 | $48,000 | $55,000 |
These are approximate MSRPs before incentives, showing the price progression across technologies. The premium for electrification varies by manufacturer and segment, but the pattern is consistent: EVs command the highest prices, followed by PHEVs, then traditional hybrids.
Impact of Federal & State Incentives
Federal tax credits can significantly reduce the effective price of electrified vehicles, though eligibility has become more complex:
- EVs: Up to $7,500 federal tax credit for models meeting domestic manufacturing and battery sourcing requirements
- PHEVs: $3,750 to $7,500 depending on battery size and manufacturing criteria
- Traditional hybrids: No federal tax credits, though some states offer incentives
Income limitations apply to federal credits (currently capped at $300,000 for joint filers and $150,000 for individuals), and manufacturer caps have been replaced with domestic content requirements.
State incentives vary dramatically by location:
- California offers up to $7,500 for income-qualified buyers through the Clean Vehicle Rebate Project
- New York provides rebates up to $2,000 at the point of sale
- Colorado offers tax credits up to $5,000 for qualifying EVs
- Several states still provide HOV lane access, reduced registration fees, or utility rebates
Financing Considerations
The financing landscape has evolved to accommodate electrified vehicles:
- Special EV loan programs: Many credit unions and banks offer rate reductions (0.25-0.5%) for EV purchases
- Lease factors: EVs often have stronger residual values than initially predicted, improving lease terms
- Incentive application: Federal tax credits can sometimes be captured by leasing companies and passed to consumers as cap cost reductions
For finance-savvy shoppers, the bottom line is clear: always calculate your “out-the-door” price after applicable incentives when comparing technologies.
True Operating Costs Breakdown
Energy Cost Comparison
The energy cost advantage varies significantly based on local rates:
Electricity vs. Gasoline Cost Per Mile
| Driving Scenario | Gas Vehicle (25 MPG) | Hybrid (45 MPG) | EV (3.5 mi/kWh) |
|---|---|---|---|
| National Average | $0.16/mile | $0.09/mile | $0.05/mile |
| California | $0.21/mile | $0.12/mile | $0.08/mile |
| Texas | $0.15/mile | $0.08/mile | $0.04/mile |
| Northeast | $0.17/mile | $0.09/mile | $0.07/mile |
Based on national averages of $3.90/gallon for gasoline and $0.16/kWh for residential electricity
The EV advantage shrinks in areas with expensive electricity and grows in regions with high fuel costs. Time-of-use utility plans can further reduce EV charging costs by up to 50% for those who charge overnight during off-peak hours.
Home vs. Public Charging Economics
Public charging typically costs 2-3 times more than home charging:
- Home Level 2 charging: $0.16/kWh national average ($8-12 for a full 250-mile charge)
- Public Level 2 charging: $0.25-0.35/kWh ($15-21 per full charge)
- DC Fast charging: $0.40-0.50/kWh ($25-35 per full charge)
For EV owners without home charging, the operating cost advantage narrows significantly if they rely primarily on public infrastructure.
Hybrid Real-World Performance
EPA estimates for hybrids tend to be more accurate than for conventional vehicles, but driving habits make a huge difference:
- Aggressive driving reduces hybrid advantage by up to 40%
- Stop-and-go traffic maximizes hybrid efficiency
- Highway-heavy driving profiles see smaller hybrid benefits
Maintenance Expense Differences
EVs eliminate numerous maintenance items required by both conventional and hybrid vehicles:
| Maintenance Item | Gas Vehicle | Hybrid | EV |
|---|---|---|---|
| Oil Changes | Every 5-10K miles | Every 5-10K miles | None |
| Transmission Service | Every 30-60K miles | Every 30-60K miles (or none) | None |
| Spark Plugs | Every 60-100K miles | Every 60-100K miles | None |
| Timing Belt/Chain | Every 60-100K miles | Every 60-100K miles | None |
| Brake Service | Every 40-60K miles | Every 60-80K miles | Every 100K+ miles |
Five-year maintenance cost estimates:
- Conventional vehicle: $3,000-4,000
- Hybrid: $2,500-3,500
- EV: $1,200-2,000
EVs’ primary maintenance revolves around tire rotation, cabin air filters, and coolant systems. Both hybrids and EVs benefit from regenerative braking, which significantly extends brake pad and rotor life.
Insurance Premium Factors

Insurance costs generally follow this pattern:
- EVs: Highest premiums (+15-25% over gas models)
- PHEVs: Moderately higher (+10-15%)
- Hybrids: Slightly higher (+5-10%)
The reasons behind EV insurance premiums include:
- Higher repair costs for damaged battery systems
- Specialized repair facilities and technicians
- More expensive replacement parts
- Higher initial vehicle values
Some insurers now offer specialized EV policies with battery coverage or discounts for clean vehicles, potentially offsetting these differences.
Hidden Ownership Costs & Benefits
Home Charging Infrastructure
For maximum EV convenience and savings, home charging is essential but adds upfront costs:
- Level 2 charger equipment: $400-$800
- Installation costs: $400-$1,500 depending on your electrical setup
- Potential panel upgrades: $1,500-$4,000 if your home needs increased electrical capacity
These infrastructure investments should be factored into the total cost of ownership, though they add value to your home and can be used for multiple vehicles over time.
Public Charging Economics
Relying on public charging not only costs more per kilowatt-hour but can affect convenience:
- Subscription services ($5-10/month) typically reduce per-kWh rates by 10-20%
- Network fragmentation means most EV owners need multiple apps or RFID cards
- Free charging still exists at some workplaces, hotels, and retailers, but is becoming less common
The public charging landscape continues to improve, but home charging capability remains a major factor in the financial equation.
Time Value Considerations
Beyond direct financial costs, consider the value of your time:
- Home charging convenience: EVs start each day with a full “tank,” eliminating gas station stops (saving ~30 minutes weekly for most drivers)
- Route planning: Long-distance EV travel requires more planning and potential charging stops
- Climate preconditioning: Both EVs and PHEVs can pre-heat or cool the cabin while plugged in, saving time and improving comfort
Depreciation & Resale Value Analysis
Depreciation Patterns by Technology
Historical depreciation data reveals interesting patterns:
- EVs traditionally depreciated faster than gas vehicles (up to 50% in 3 years vs. 35-40% for gas models)
- Modern EVs from established manufacturers are showing improved value retention, particularly premium brands (Tesla, Porsche, etc.)
- Hybrids typically depreciate at rates similar to or slightly better than their gas counterparts
- PHEVs have shown mixed results, with some models depreciating quickly and others holding value well
The most significant factors affecting EV depreciation are:
- Battery longevity and degradation
- Technological obsolescence as newer models offer more range
- Availability of tax incentives for new purchases
Battery Warranty Considerations
Battery warranties significantly impact resale values:
- Most EV manufacturers offer 8-10 year/100,000-150,000 mile battery warranties
- Warranties typically guarantee against failure and excessive degradation (usually below 70% of original capacity)
- Some warranties are fully transferable to subsequent owners, enhancing resale value
Battery health is the most critical factor when considering a used EV. Many brands now offer battery health reports, and independent evaluations are becoming more accessible.
The Ownership Timeline: When Each Option Pays Off
Break-Even Analysis
The payback period varies dramatically based on your circumstances:
Sample Break-Even Scenarios
| Driver Profile | Hybrid vs. Gas | PHEV vs. Gas | EV vs. Gas |
|---|---|---|---|
| Low Mileage (8K/year), No Home Charging | 7-8 years | Never | Never |
| Average (12K/year), Home Charging | 5-6 years | 7-8 years | 8-9 years |
| High Mileage (20K/year), Home Charging | 3-4 years | 4-5 years | 5-6 years |
| High Mileage, Expensive Gas Region | 2-3 years | 3-4 years | 4-5 years |
These estimates assume typical price differences between technologies, average fuel and electricity costs, and include typical maintenance savings.
Five-Year Total Cost of Ownership
When all factors are considered over a five-year ownership period, the financial comparison looks like this for an average midsize sedan:
| Cost Category | Gas Model | Hybrid | PHEV | EV |
|---|---|---|---|---|
| Purchase Price (after incentives) | $28,000 | $32,000 | $34,000 | $37,000 |
| Fuel/Energy | $9,000 | $5,000 | $3,500 | $2,500 |
| Maintenance | $3,500 | $3,000 | $2,500 | $1,500 |
| Insurance | $6,000 | $6,300 | $6,600 | $7,000 |
| Depreciation | $14,000 | $15,000 | $17,000 | $19,000 |
| Charging Infrastructure | $0 | $0 | $1,000 | $1,500 |
| TOTAL 5-YEAR COST | $60,500 | $61,300 | $64,600 | $68,500 |
This example shows that under average circumstances, the hybrid comes closest to cost parity with gas vehicles over five years, while EVs remain more expensive despite operational savings. However, individual circumstances can dramatically alter this equation.
Decision Framework Based on Lifestyle
Best Financial Choice for Different Drivers
Urban Commuters with Home Charging
Best option: EV or PHEV
Why: Short trips maximize electric-only driving, regenerative braking shines in stop-and-go traffic, and home charging ensures lowest energy costs.

Apartment Dwellers Without Dedicated Charging
Best option: Hybrid or PHEV with workplace charging
Why: Without affordable home charging, EVs lose much of their operating cost advantage while hybrids require no charging infrastructure.

Highway Commuters with Predictable Routes
Best option: Hybrid for moderate commutes, EV for longer distances if home charging is available
Why: Hybrids still perform efficiently on highways while EVs can save substantially on high-mileage commutes despite less optimal highway efficiency.
Rural Drivers with Limited Charging Infrastructure
Best option: Hybrid or PHEV.
Why: Range concerns and charging limitations make full EVs impractical in some rural areas, while hybrids offer efficiency without infrastructure dependence.

Financial Impact of Driving Habits
Annual mileage makes a dramatic difference in the financial equation:
- Under 8,000 miles annually: Hybrids offer the best financial case, as higher-priced EVs struggle to recover their premium through operational savings
- 12,000-15,000 miles annually: Hybrids still lead for most drivers, though PHEVs become competitive with home charging
- Over 20,000 miles annually: EVs begin to make clear financial sense for drivers with home charging, as fuel savings accelerate the payback period
Climate considerations also affect the calculus:
- Extreme cold can reduce EV range by 20-30% temporarily
- Hybrids perform better in cold weather relative to their EPA ratings
- Hot climates reduce the efficiency gap between technologies
Making Your Decision: A Personal Equation
After analyzing the numbers, it’s clear that the financial wisdom of choosing an EV, hybrid, or PHEV depends on your specific circumstances. Here’s a simple framework to determine which technology might make the most financial sense for you:
- Do you have access to home charging?
- No → Hybrid likely makes most financial sense
- Yes → Continue to question 2
- How many miles do you drive annually?
- Under 10,000 → Hybrid probably offers best financial case
- 10,000-15,000 → Hybrid or PHEV depending on driving patterns
- Over 15,000 → PHEV or EV likely offers better long-term value
- What’s your typical driving pattern?
- Mostly short trips → EV or PHEV advantage increases
- Mostly highway → Hybrid advantage improves
- Mixed driving → Consider a PHEV for flexibility
- How long do you keep vehicles?
- 3 years or less → Hybrid likely offers best financial case
- 5+ years → EV or PHEV advantage improves as operational savings accumulate
- 10+ years → EV likely offers best lifetime value as initial premium is fully recovered
- What are your local electricity rates and gas prices?
- High electricity, lower gas → Hybrid advantage
- Low electricity, higher gas → EV advantage
The bottom line? Traditional hybrids still offer the quickest financial payback for most drivers, while EVs make the most sense for high-mileage drivers with home charging who plan to keep their vehicles long-term. PHEVs occupy a sweet spot for many drivers, combining electric efficiency for daily commuting with gas flexibility for longer trips.
What has your experience been with electrified vehicles? Has the financial reality matched your expectations? Share your thoughts in the comments!